A fiber optic coupler is a passive device that splits, combines, or taps optical signals between fibers. This guide covers the five main coupler types, six critical parameters to check before purchasing, manufacturing technology differences (FBT vs PLC), and real-world selection advice for PON, CATV, monitoring, and sensing applications.
If you are new to passive optical components, it is easy to confuse couplers, splitters, and adapters. These three terms come up constantly, but they refer to very different things. A fiber optic coupler is a passive optical device that redistributes optical power between two or more fibers - it can split one signal into many, combine several signals into one, or tap a small portion of light for monitoring. A fiber optic splitter is essentially a specific application of a coupler, focused on dividing one input into multiple outputs. A fiber optic adapter, on the other hand, is just a mechanical fitting that aligns two connectors end-to-end - it does not split or combine any optical signal at all.

This distinction matters because choosing the wrong component is one of the most common purchasing mistakes in fiber projects. Couplers are widely used in PON networks, CATV distribution, LAN architectures, network monitoring, test systems, and fiber sensing setups. Understanding how they work and what to look for will save you both time and budget.

What Exactly Does a Fiber Optic Coupler Do?
A fiber coupler takes optical power from one or more input fibers and redistributes it to one or more output fibers according to a defined ratio. It does not amplify or regenerate light - it simply divides or combines what is already there.
In practice, optical couplers serve four primary functions: signal splitting (dividing one optical path into two or more), signal combining (merging multiple paths into one), signal tapping (extracting a small percentage of light for monitoring without interrupting the main path), and optical power distribution (delivering light to multiple endpoints in a network).
In FTTH and PON systems, couplers distribute downstream signals from the OLT to dozens or even hundreds of subscribers. In CATV headend distribution, they send a single source to many receiving nodes. In network monitoring, tap couplers pull off 5–10% of signal power for analysis while the remaining 90–95% continues to the end user undisturbed. In laboratory environments - interferometers, OCT systems, fiber gyroscopes - 2×2 couplers are standard building blocks.
How Does a Fiber Optic Coupler Work?
Unlike a simple connector or splice that passes light straight through, a coupler deliberately redirects optical energy between different ports. The physics behind this depends on the manufacturing method, but the most commonly encountered mechanism in fused fiber couplers is evanescent field coupling.

Evanescent Field Coupling: The Core Mechanism
When two bare optical fibers are placed side by side, heated, and stretched together in a controlled process, their cores come close enough that their optical fields overlap. In this tapered coupling region, photons are no longer fully confined to one core. Some of the optical energy "leaks" across to the neighboring fiber core through the overlapping evanescent field.
By precisely controlling the length of the coupling zone and the degree of tapering, manufacturers determine what percentage of light transfers from one fiber to the other. A longer coupling region generally transfers more power to the second fiber. This is how different split ratios - 50:50, 70:30, 90:10, and so on - are achieved in fused biconical taper (FBT) couplers.
In our experience working with FBT devices, the coupling ratio is also somewhat wavelength-sensitive. A coupler tuned for a precise 50:50 split at 1310 nm may show a ratio closer to 45:55 at 1550 nm, depending on design. This is why you should always check whether a coupler is rated for single-window or dual-window operation before ordering.
Why Every Coupler Introduces Loss
Once you split an optical signal, each output path carries less power than the original input. This is not a flaw - it is the fundamental physics of power division. A perfect 1×2 50:50 split would result in exactly 3.0 dB of insertion loss per port simply from dividing the power in half. In practice, real devices add an additional 0.1–0.5 dB of excess loss on top of that theoretical minimum due to manufacturing imperfections, fiber alignment, and scattering in the coupling region.
This is important for link budget calculations. In a PON network with multiple splitting stages, each coupler stage adds both splitting loss and excess loss. If you do not account for this accurately, the optical power at the subscriber end may fall below the receiver sensitivity threshold, resulting in bit errors or link failure.
Types of Fiber Optic Couplers
Couplers can be classified by their port configuration and function. Below are the five main types you will encounter, along with when to use each.

Y Coupler: The Standard 1×2 Split
The Y coupler is the simplest and most common form. It takes one input and divides it into two outputs, resembling the shape of the letter Y. Most standard Y couplers offer a 50:50 split ratio, making them the go-to choice for basic signal distribution and simple power splitting. They are available in both single-mode and multimode versions, and you will find them in everything from desktop test setups to field-deployed distribution panels.
Typical insertion loss for a good-quality 1×2 Y coupler at 50:50 split: approximately 3.2–3.5 dB per port (3.0 dB theoretical splitting loss plus 0.2–0.5 dB excess loss).
T Coupler: Unequal Splitting for Tap Applications
A T coupler is functionally similar to a Y coupler but designed with an asymmetric split ratio - typically 90:10, 80:20, or 70:30. The primary use case is signal tapping: you extract a small fraction of the optical power for monitoring or measurement while keeping the majority of the signal on the main transmission path.
For example, in a live network monitoring scenario, a 90:10 T coupler sends 90% of the signal to the downstream user and taps 10% to a monitoring port. The insertion loss on the main (90%) port would be around 0.6–0.8 dB, while the tap (10%) port sees about 10.5–11.0 dB. This is acceptable because the monitoring device typically only needs a small amount of power to perform measurements.
2×2 Coupler (X Coupler): Split and Combine
A 2×2 coupler has two input ports and two output ports, making it the most versatile standard coupler type. Unlike a simple 1×2, it can both split and combine signals in a single device, which is why it is sometimes called an X coupler or directional coupler.
In practice, 2×2 couplers are essential in interferometric sensor systems, bidirectional communication links, and optical test instruments where light from two separate sources must be combined or where a signal must be simultaneously split and cross-coupled. Many Mach-Zehnder and Michelson interferometer configurations depend on 2×2 couplers as their central beam-splitting element.
Standard specifications for a quality 2×2 coupler: insertion loss of 3.2–3.8 dB per path at 50:50 split, directivity better than 55 dB, and return loss greater than 55 dB for single-mode fiber versions.
Star Coupler: Multi-Port Uniform Distribution
A star coupler is designed for N×N or N×M configurations where the goal is to distribute optical power as evenly as possible among many ports. In older LAN architectures and certain avionics or military fiber networks, star couplers provided a simple way to connect multiple nodes without active switching equipment.
The challenge with star couplers is that insertion loss scales with port count. An 8×8 star coupler introduces at least 9.0 dB of splitting loss per port (from dividing by 8), plus excess loss. This limits practical use to systems where the link budget can tolerate significant attenuation, or where the number of nodes is small enough to keep total loss manageable.
Tree Coupler: Cascaded One-to-Many Distribution
A tree coupler follows a branching topology: one input port splits progressively into 4, 8, 16, 32, or even 64 output ports in stages. This is the architecture behind the PLC splitters used in most modern FTTH and GPON deployments.
A 1×8 tree coupler has a minimum theoretical splitting loss of 9.0 dB; a 1×16 adds at least 12.0 dB; and a 1×32 introduces 15.0 dB. With excess loss factored in, real-world insertion loss values are typically 10.0–10.8 dB for 1×8, 13.0–13.8 dB for 1×16, and 16.0–17.5 dB for 1×32, according to ITU-T G.671 performance guidelines for passive optical components.
A Note on Classification: Structure vs. Technology vs. Wavelength Function
A common source of confusion: Y, T, 2×2, star, and tree describe the coupler's port configuration and function. FBT and PLC describe the manufacturing technology used to build that coupler. WDM couplers are categorized by their wavelength-selective function - they separate or combine different wavelengths rather than splitting the same wavelength.
These are three separate classification axes. A 1×2 coupler can be built using FBT or PLC technology. A WDM coupler might physically be a 2×2 device. Understanding this prevents you from comparing apples to oranges when specifying components.
Manufacturing Technology: FBT vs. PLC vs. Micro-Optics
The manufacturing method directly affects performance consistency, size, split count capability, and cost. Here is what you need to know about each approach.

Fused Biconical Taper (FBT)
FBT is the most established coupler technology. Two or more fibers are stripped, twisted together, heated with a flame or electric heater, and pulled until the coupling region forms. This process is well-understood, relatively inexpensive, and works very well for 1×2 and 2×2 configurations.
Where FBT shows its limitations is at higher split counts. Building a 1×8 FBT splitter requires cascading multiple 1×2 stages, which accumulates excess loss and makes uniformity harder to control. For split ratios above 1×4, the output uniformity of FBT devices degrades compared to PLC alternatives. FBT couplers also tend to be more wavelength-sensitive, so dual-window performance (1310/1550 nm) requires careful specification.
Best suited for: 1×2 and 2×2 couplers, tap applications, cost-sensitive deployments with low to moderate split counts.
Planar Lightwave Circuit (PLC)
PLC splitters are fabricated using semiconductor lithography techniques on a silica-on-silicon substrate. The waveguide pattern is etched onto the chip, giving manufacturers extremely precise control over the splitting geometry.
The result is superior output uniformity across all ports, consistent performance over a wide wavelength range (typically 1260–1650 nm), and excellent scalability up to 1×64 or even 1×128 in a compact package. The trade-off is higher unit cost compared to FBT at low split counts. However, for PLC splitters in ABS packaging at 1×8 and above, the per-port cost often becomes competitive with or even lower than cascaded FBT solutions.
According to Telcordia GR-1209-CORE and GR-1221-CORE, which are the primary reliability standards for passive optical components, PLC devices typically demonstrate better long-term stability under temperature cycling and environmental stress testing. This is one reason why most major telecom operators specify PLC technology for their GPON and XGS-PON deployments.
Best suited for: FTTH/PON with high split counts, deployments requiring strong uniformity, wide operating wavelength range, and long-term environmental reliability.
Micro-Optics
Micro-optic couplers use discrete miniature components - lenses, prisms, thin-film filters, and mirrors - mounted in a small housing to redirect light between fibers. This gives designers the most flexibility in creating custom optical paths, wavelength filtering, and polarization control.
These devices are most commonly found in specialized applications such as WDM couplers, high-isolation tap modules, and laboratory instrumentation. They are generally not used in high-volume access network deployments due to their higher cost and more complex assembly process.
Quick Comparison: FBT vs. PLC
| Parameter | FBT | PLC |
|---|---|---|
| Typical split count | 1×2 to 1×4 (practical) | 1×2 to 1×64 (or higher) |
| Output uniformity (1×8) | ±1.0–1.5 dB | ±0.5–0.8 dB |
| Operating wavelength | Usually single or dual window | Broadband 1260–1650 nm |
| Excess loss (1×8) | 1.0–2.0 dB typical | 0.6–1.2 dB typical |
| Unit cost (low split) | Lower | Higher |
| Unit cost (high split) | Higher (cascaded stages) | Competitive or lower |
| Temperature stability | Good | Better |
| Size at high port count | Larger | Compact |
Six Critical Parameters to Check Before Choosing a Coupler
Selecting a fiber coupler on port count and price alone is a recipe for field problems. Here are the six specifications that actually determine whether a coupler will work in your system.

1. Insertion Loss
Insertion loss is the total optical power loss measured between the input port and a specific output port. It includes both the inherent splitting loss (which is unavoidable - physics dictates that splitting power reduces per-port output) and the excess loss introduced by the device.
For link budget planning, insertion loss is the number that matters most. For reference, here are typical insertion loss values for common configurations:

| Split Configuration | Theoretical Splitting Loss | Typical Total Insertion Loss (PLC) |
|---|---|---|
| 1×2 | 3.0 dB | 3.2–3.8 dB |
| 1×4 | 6.0 dB | 6.5–7.5 dB |
| 1×8 | 9.0 dB | 10.0–10.8 dB |
| 1×16 | 12.0 dB | 13.0–13.8 dB |
| 1×32 | 15.0 dB | 16.0–17.5 dB |
| 1×64 | 18.0 dB | 19.0–21.0 dB |
If a supplier quotes insertion loss figures significantly better than these ranges, ask for test data. Numbers that look too good on paper often come from cherry-picked samples rather than production averages.
2. Excess Loss
Excess loss isolates just the additional loss beyond the theoretical splitting minimum. It is calculated by comparing total input power to the sum of all output powers. In a well-made 1×8 PLC splitter, excess loss is typically 0.6–1.2 dB. In an FBT-based 1×8, it can be 1.0–2.0 dB or higher because of cascaded stage inefficiencies.
Excess loss is a useful quality indicator. If two vendors offer the same split ratio but one shows notably higher excess loss, that usually points to lower manufacturing quality or older production processes.
3. Split Ratio (Coupling Ratio)
The split ratio tells you how optical power is divided between output ports. Common ratios include 50:50 for equal distribution, 90:10 or 80:20 for monitoring taps, and 70:30 for specialized routing.
One detail that many buyers overlook: the stated split ratio is specified at a particular wavelength. A coupler rated 50:50 at 1310 nm might actually deliver 48:52 or 45:55 at 1550 nm, especially for FBT devices. If your system runs dual wavelength, make sure the ratio specification covers both windows.
4. Return Loss and Directivity
Return loss measures how much light is reflected back toward the source. Directivity measures how well the coupler prevents light from leaking into the wrong input port. In most standard telecom couplers, return loss is ≥55 dB and directivity is ≥55 dB for single-mode devices.
These parameters become critical in bidirectional systems, coherent detection setups, and precision measurement instruments. Poor return loss causes source instability (especially in DFB lasers), and poor directivity introduces crosstalk. For laboratory-grade applications, look for return loss ≥60 dB.
5. Polarization Dependent Loss (PDL)
PDL quantifies the variation in insertion loss as the polarization state of input light changes. In standard access network couplers, PDL is typically 0.1–0.3 dB and rarely causes noticeable issues. However, in coherent optical systems, fiber sensing (especially fiber Bragg grating interrogators and distributed sensing), and precision measurement setups, PDL must be kept below 0.1 dB to avoid introducing measurement uncertainty.
If you are building a sensing system or working with polarization-sensitive instruments, PDL should be on your specification checklist - not treated as an afterthought.
6. Operating Wavelength and Bandwidth
A coupler designed for 1310 nm operation will not necessarily perform correctly at 1550 nm, and vice versa. Broadband couplers (typically rated for 1260–1650 nm) cover the full single-mode telecom window but may have slightly higher excess loss than single-window devices optimized for one wavelength.
For PON systems carrying both 1310 nm upstream and 1490/1550 nm downstream, you need a coupler rated for the full operating band. For simple point-to-point links at a single wavelength, a single-window coupler may offer marginally better performance and lower cost.
How to Choose a Fiber Optic Coupler by Application

FTTH and PON Deployments
In FTTH and GPON/XGS-PON, the dominant requirements are high split count capability (1×16, 1×32, or 1×64), strong output uniformity across all ports, broadband operation covering 1260–1650 nm, and reliable performance across a wide temperature range (typically −40°C to +85°C for outdoor installations).
PLC technology is the clear choice here. The combination of uniform output, wide wavelength range, and compact form factor for high split counts makes PLC the standard in virtually all modern PON deployments. Most operators specify LGX-box or cassette-packaged PLC splitters for rack-mounted installations, and fiber distribution boxes with built-in splitters for outdoor pole or wall-mount scenarios.
CATV Distribution
CATV optical distribution networks demand low insertion loss (because the signal passes through multiple splitting stages between the headend and the subscriber), good performance at 1550 nm (the standard CATV downstream wavelength), and scalable distribution architecture.
In CATV, even 0.5 dB of additional loss at a splitting point can degrade the carrier-to-noise ratio at the subscriber end. This makes excess loss a particularly important specification to compare between vendors. For backbone distribution, PLC splitters with broadband ratings are preferred. For local tap points with only 2–4 outputs, FBT couplers remain cost-effective.
Network Testing and Monitoring
For live network monitoring, the goal is to extract enough optical power for measurement without meaningfully impacting the service link. A 90:10 or 95:5 T coupler is the standard solution - the main path sees only 0.5–0.7 dB of loss from the tap, which is within the margin of most link budgets.
When selecting a tap coupler for monitoring, pay attention to directivity and return loss. In bidirectional PON links, poor directivity in the tap module can introduce crosstalk between upstream and downstream signals. Also verify that the tap coupler's connector type matches your monitoring equipment - SC/APC and LC connectors are the most common in modern test setups.
Laboratory, Sensing, and Precision Optical Systems
In laboratory environments - interferometers, OCT systems, fiber gyroscopes, distributed fiber sensing - the requirements go well beyond simple splitting. Engineers typically need 2×2 functionality, broadband or wavelength-flat performance, low excess loss (under 0.5 dB), high directivity (≥60 dB), and low PDL (under 0.1 dB).
For these applications, the coupler is not just a power divider - it is an integral optical element that directly affects measurement accuracy. Spending more on a precision-grade coupler here is almost always justified, because the cost of the coupler is trivial compared to the cost of unreliable measurement results.
Common Selection Mistakes to Avoid
Ignoring wavelength compatibility. This is the single most common mistake we see. A buyer selects a coupler based on split ratio and price, only to discover in the field that it was designed for 1310 nm single-window operation while the system runs at 1550 nm. The result: the split ratio shifts, insertion loss increases, and the link fails or operates with no margin. Always verify the operating wavelength window.
Checking split ratio but not insertion loss. A coupler labeled "50:50" tells you the power division, but the actual usable power depends on insertion loss. Two 50:50 couplers from different vendors can have insertion loss values that differ by 1 dB or more, which translates to a significant difference in system margin.
Confusing couplers, splitters, and adapters. This leads to ordering the wrong product entirely. A fiber optic adapter will not split your signal. A coupler will not simply join two connector ends. Make sure the component category matches the function you need.
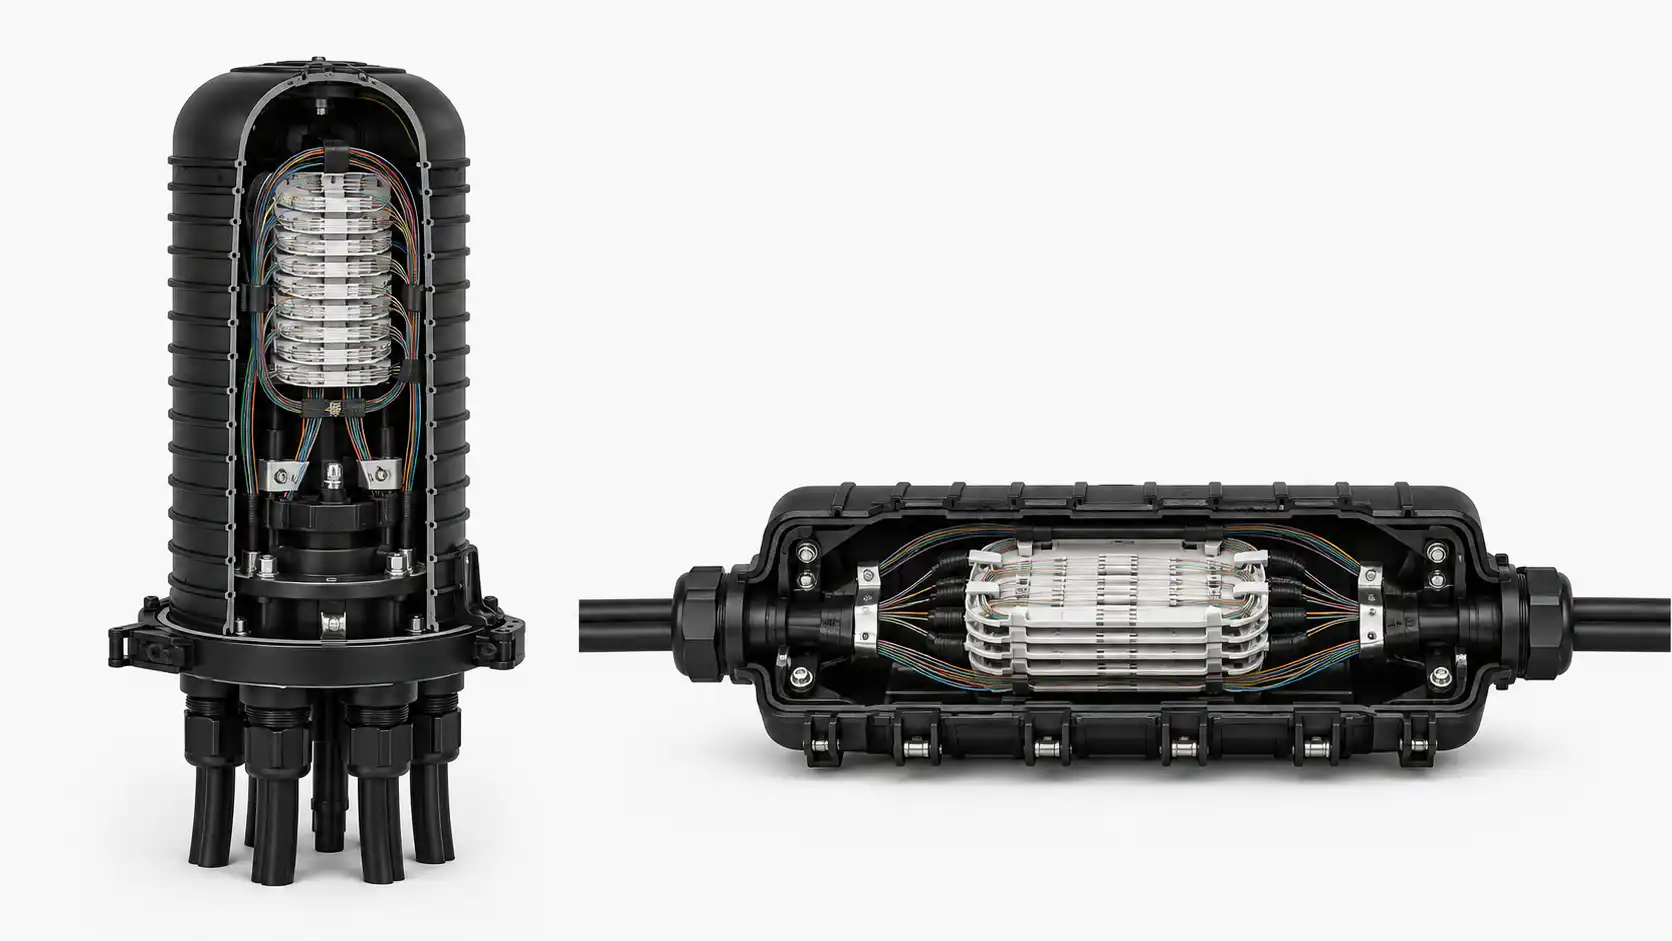
Overlooking connector and packaging requirements. A bare fiber pigtail coupler works fine on a lab bench but is unsuitable for a field-deployed splice closure or distribution cabinet. Confirm that the connector type, package form factor, operating temperature range, and environmental protection rating match your deployment environment. A coupler rated for indoor use at 0–50°C will not survive in an outdoor aerial cabinet that sees −30°C winters.
Mixing single-mode and multimode components. Single-mode fiber has a core diameter of approximately 9 µm, while multimode fiber cores range from 50 to 62.5 µm. The mode field mismatch makes them fundamentally incompatible in a coupler. Using a single-mode coupler on multimode fiber (or vice versa) will cause severe additional loss and unpredictable performance. Always match the coupler's fiber type to your network fiber type.
Frequently Asked Questions
What is the difference between a 1×2 coupler and a 2×2 coupler?
A 1×2 coupler has one input and two outputs - it splits light in one direction. A 2×2 coupler has two inputs and two outputs, allowing it to both split and combine optical signals. This makes 2×2 couplers necessary for interferometric systems, bidirectional links, and applications where optical power must be redistributed between two paths simultaneously. If you only need simple one-to-two splitting, a 1×2 is sufficient and less expensive.
When should I choose FBT over PLC, and vice versa?
Choose FBT when you need 1×2 or 2×2 couplers, when cost is a primary concern, and when you are working with low split counts (up to 1×4). Choose PLC when you need high split counts (1×8 and above), strong output uniformity, broadband wavelength coverage, or when deploying in environments that demand long-term stability. For most FTTH and PON projects, PLC has become the de facto standard.
Why does optical power drop so much after splitting?
Because a coupler divides existing optical power - it does not create new photons. When you split a signal into two equal paths, each path receives half the power, which corresponds to a 3.0 dB reduction. Split into four paths and each sees a 6.0 dB reduction. Split into 32 paths and each port is 15.0 dB below the input. On top of this theoretical minimum, every real device adds some excess loss from manufacturing imperfections. This is why link budget calculation is essential before selecting a split ratio.
Can I use a single-mode coupler with multimode fiber?
No. The core size difference between single-mode (9 µm) and multimode (50 or 62.5 µm) fiber means the coupling mechanism will not work as designed. Light will be lost at the mode field mismatch points, the split ratio will be unpredictable, and total loss will be far higher than specified. Always match the coupler type to your fiber infrastructure.
What standards apply to fiber optic couplers?
The most commonly referenced standards are IEC 61753 (performance standard for passive optical components in fiber optic systems), IEC 61755 (fiber optic connector optical interfaces), Telcordia GR-1209-CORE (generic requirements for passive optical components), and Telcordia GR-1221-CORE (reliability assurance for passive optical components). For WDM couplers specifically, ITU-T G.671 covers transmission characteristics of optical components and subsystems. When evaluating vendors, ask whether their products are tested against these standards.
Conclusion

A fiber optic coupler is a core passive component in any optical network - not an afterthought accessory. Whether you are distributing GPON signals to 64 subscribers, tapping 5% of a live link for monitoring, combining signals in a laboratory interferometer, or routing power in a CATV distribution tree, the coupler you choose directly affects your system's performance, margin, and reliability.
The most effective selection approach is straightforward: start by defining your application requirements, then select the port configuration and function you need (Y, T, 2×2, tree, or star), choose the appropriate manufacturing technology (FBT for simplicity and low cost at small splits, PLC for uniformity and scalability at high splits), and finally verify that the six key parameters - insertion loss, excess loss, split ratio, return loss, directivity, PDL, and operating wavelength - all meet your system specifications. Do that, and coupler selection becomes an engineering decision rather than a guessing game.
If you have specific questions about selecting the right splitter or coupler for your project, feel free to contact our engineering team for technical guidance.